
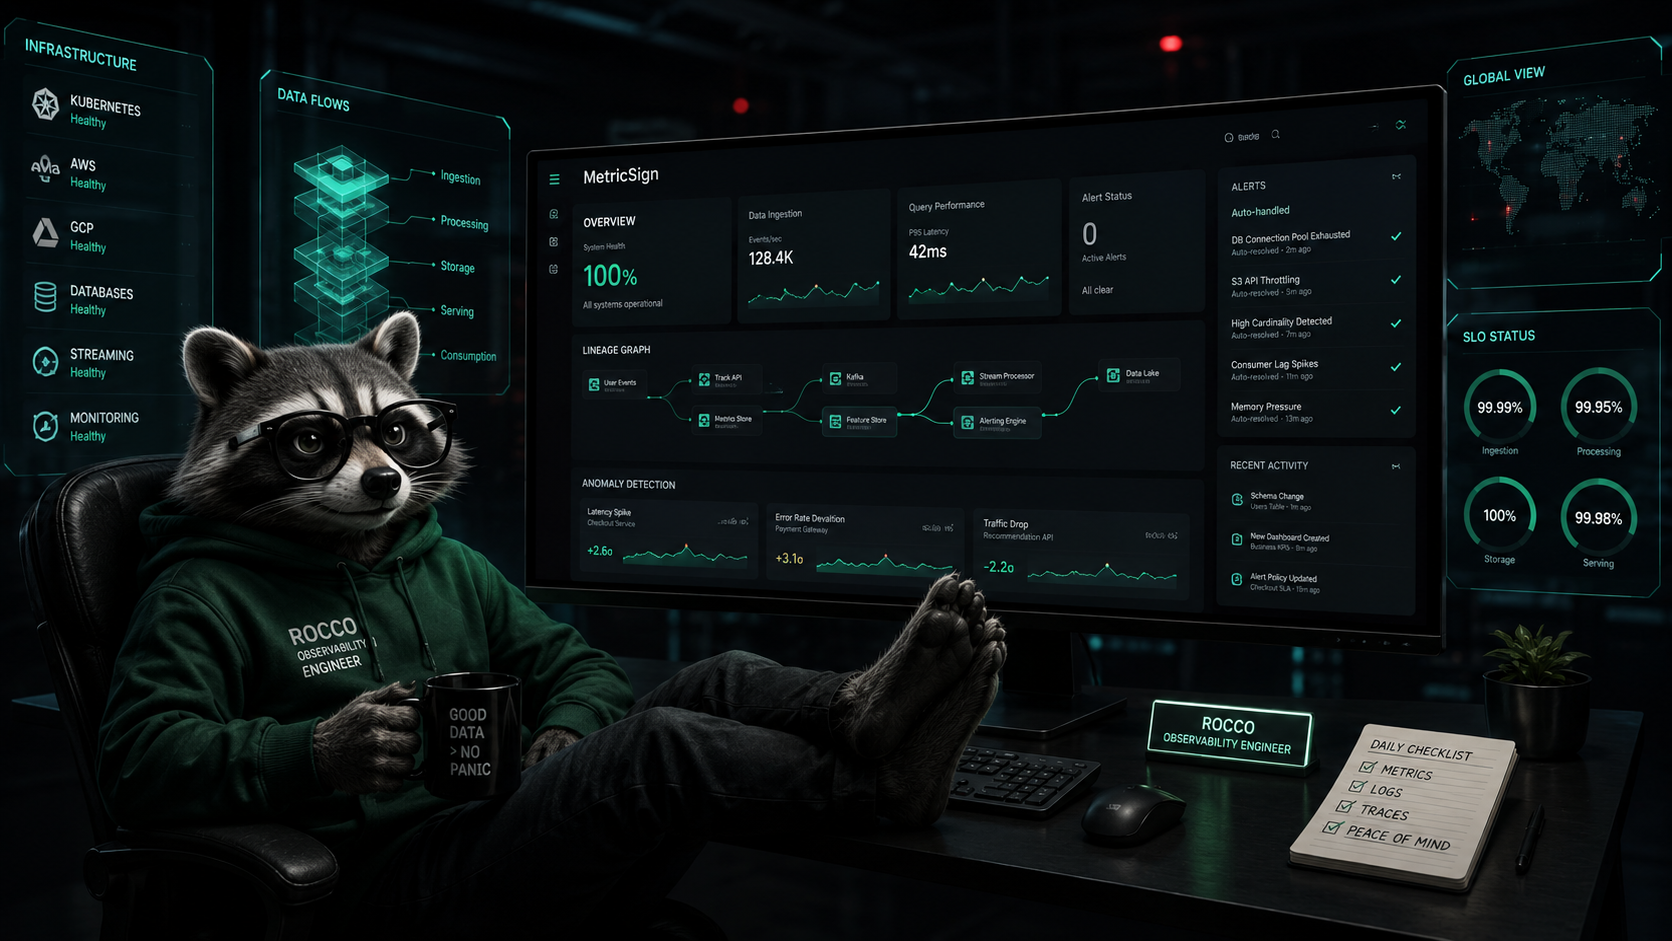
The silent failure that costs more than the outage
On a Tuesday morning, the finance team at a mid-sized SaaS company opens a board-ready dashboard and notices something off. Revenue from the EMEA region is missing entirely. The number isn't wrong, exactly. It's just not there.
It takes the data team six hours to trace the issue: a silent schema change in an upstream Salesforce export had renamed a column three days ago. The dbt model dropped the rows. The Power BI refresh succeeded. No alert fired anywhere in the pipeline.
This is what makes data incidents different from application incidents. A web app that goes down is loud. A data pipeline that goes wrong is silent — until someone in finance, marketing, or the C-suite makes a decision on bad numbers.
According to Wakefield Research, data engineers spend an average of 40% of their time dealing with data quality issues, and the typical organisation experiences 70 data incidents per year per 1.000 tables. (Monte Carlo, 2024)
A data observability tool exists to flip that ratio.
What a data observability tool actually does
A data observability tool continuously monitors the health of your data and the pipelines that produce it. It collects metadata, runs automated checks, surfaces anomalies, and traces issues to their root cause across every system in the chain.
The distinction worth burning into your brain:
| Tool type | What it watches | What it answers |
|---|---|---|
| Pipeline orchestrator (Airflow, ADF) | Job runs and schedules | Did the job run? |
| Data quality tool (Great Expectations, dbt tests) | Rules on a specific table | Does this column meet my rule? |
| Data observability tool | The data itself, end-to-end | Is anything weird happening, anywhere? |
A pipeline orchestrator tells you a job succeeded. A data quality tool tells you a rule passed. A data observability tool tells you the dashboard your CFO is about to open contains numbers that don't match yesterday's reality — even if no rule was ever written for it.
The last part is what makes the category interesting. The best data observability tools detect problems you didn't think to write a check for.
The five capabilities that actually matter
Vendors love feature checklists. Most boil down to five capabilities. If a tool is missing two or more, it isn't really a data observability tool — it's a dashboard.
1. Freshness monitoring Is the most recent timestamp in your data what you'd expect for this hour, day, or week? A model that should refresh every morning at 6 AM but quietly stopped four days ago is the single most common silent failure in data work.
2. Volume anomaly detection If yesterday's pipeline produced 1.2 million rows and today's produced 80, something broke upstream. Volume is a leading indicator of nearly every type of pipeline problem, and a good tool flags drops without you needing to define a threshold per table.
3. Schema change tracking Upstream sources change. Columns get renamed, dropped, or retyped without warning. A schema-aware tool detects these changes the moment they happen, not three sprints later when a downstream report starts returning empty.
4. Distribution and value checks Is the spread of your numeric columns within historical norms? Are the categorical values you expect still present? This is where statistical anomaly detection earns its keep — catching the type of issue where the data is technically present but wrong.
5. End-to-end lineage When something breaks, the question is never "what's wrong?" It's "what's downstream of this, and who needs to know?" A tool without lineage forces your team to answer that manually for every incident, which is exactly when they have the least time.
A 2024 Gartner study estimated that poor data quality costs organisations an average of $12.9 million per year, with much of that loss attributable to delayed detection rather than the underlying error. (Gartner, via TechTarget)
Note what's not on this list: pretty dashboards, AI-generated incident summaries, and 200-page implementation guides. Useful, sometimes. Decisive, never.
Tool vs platform vs framework: stop calling everything observability
The category has a naming problem. Three terms get used interchangeably and they shouldn't be.
| Term | What it means | Examples |
|---|---|---|
| Data observability framework | A philosophy or methodology | The 'five pillars' approach popularised by Barr Moses (Monte Carlo) |
| Data observability tool | A specific product that monitors one or more aspects of data health | Soda, Elementary, Bigeye, MetricSign |
| Data observability platform | An integrated suite — observability tool + lineage + cataloging + governance | Monte Carlo, Acceldata, Datafold |
A tool is something you can install in an afternoon and start getting value from in a week. A platform is something you procure, integrate, and roll out across teams over months. Both have their place. The mistake is buying a platform when you needed a tool — or worse, buying a framework deck when you needed software.
"The biggest source of waste in data observability projects is over-buying. Teams pick a platform because it has every feature, then use 15% of it." — paraphrased from a 2024 dbt Coalesce panel on monitoring stack design.
Signs you need one (and signs you don't yet)
Not every team needs a dedicated data observability tool. Here's a quick gut-check.
You probably need one if:
- More than one business team has noticed bad data before your data team did, in the last quarter
- Your data engineers spend more than two days a month debugging silent failures
- You have more than 50 production tables, models, or reports
- You operate across more than two tools (e.g. ADF + Databricks + Power BI) and need cross-stack lineage
- Compliance or audit requires you to demonstrate data quality SLOs
You probably don't need one yet if:
- Your stack is a single tool with built-in monitoring (e.g. only Snowflake with native alerts)
- You have fewer than 10 production datasets
- Data issues are rare and a single Slack channel surfaces them quickly
- Your team is fewer than three people and the on-call burden is manageable
In that second category, dbt tests plus a few well-placed pipeline alerts will get you 80% of the value at 0% of the cost. The right time to upgrade is when you've outgrown that — not before.
What to evaluate before you commit
If you've decided you need a data observability tool, the evaluation matters more than the shortlist. We've seen teams pick the wrong tool because they evaluated against the wrong criteria.
Time to first value. How long from signup to a useful alert? If the answer is "weeks of integration work," that tool is not for a small data team.
Coverage of your specific stack. A tool that only watches Snowflake won't help if your problems live in Power BI refreshes or ADF pipelines. Evaluate the connector list against your actual stack, not against a generic Modern Data Stack diagram.
Alert quality, not alert quantity. Demo every tool by deliberately introducing a real failure (drop a column, delay a refresh, send wildly anomalous data) and see what fires. Useless alerts train your team to ignore real ones.
Pricing model fit. Per-table pricing penalises stacks with many small tables. Consumption pricing penalises spiky usage. Per-seat pricing penalises teams with many casual users. Match the model to your shape.
Ownership of the metadata. Some tools store all your metadata in their cloud. Some run as a sidecar in your environment. Some publish results to your warehouse. The right answer depends on your security posture, but it's a question many teams forget to ask.
An IDC report estimated that data engineers spend up to 30% of their time on incident triage and root cause analysis, time that scales linearly with stack complexity unless tooling absorbs the load. (IDC InfoBrief, 2023)
Common mistakes when adopting one
Most teams that adopt a data observability tool report mixed results six months in. The pattern of mistakes is consistent.
Mistake 1: Treating it as a replacement for tests. Observability detects what you didn't think to test. It doesn't replace the tests you should have written. The two work together.
Mistake 2: Onboarding everything at once. A tool that monitors 2.000 tables on day one will produce 2.000 noisy alerts on day two. Start with the 20 datasets that drive the most-watched dashboards. Expand from there.
Mistake 3: Ignoring the runbook. An alert with no owner, no severity, and no first-step action is just a notification. The tool doesn't fix incident response — your process does.
Mistake 4: Forgetting business context. Technical monitoring tells you the pipeline broke. Business context tells you it broke at month-end and the CFO is meeting investors in three hours. The best tools let you tag datasets with that context and route alerts accordingly.
Mistake 5: Not measuring the ROI. Track three numbers from the day you start: median time to detect, median time to resolve, and incidents reaching a business user. If those don't move in 90 days, the tool isn't earning its keep — or you haven't onboarded it properly.
Where MetricSign fits
We built MetricSign because the data observability tool market overwhelmingly assumes you live in the modern data stack — Snowflake, dbt Cloud, Looker. If your reality is Microsoft (Power BI, ADF, Fabric, Databricks), most of the market doesn't connect.
MetricSign is a data observability tool focused on the Microsoft data stack. It connects to Power BI, ADF, Databricks, dbt (Cloud and Core), Fabric, and Snowflake — and watches all five capabilities listed above across that stack, with cross-tool lineage included.
We're a tool, not a platform. You can connect it in 15 minutes and have your first alert the same day. That's deliberate — most teams need a tool that solves one specific problem well, not a year-long implementation.