
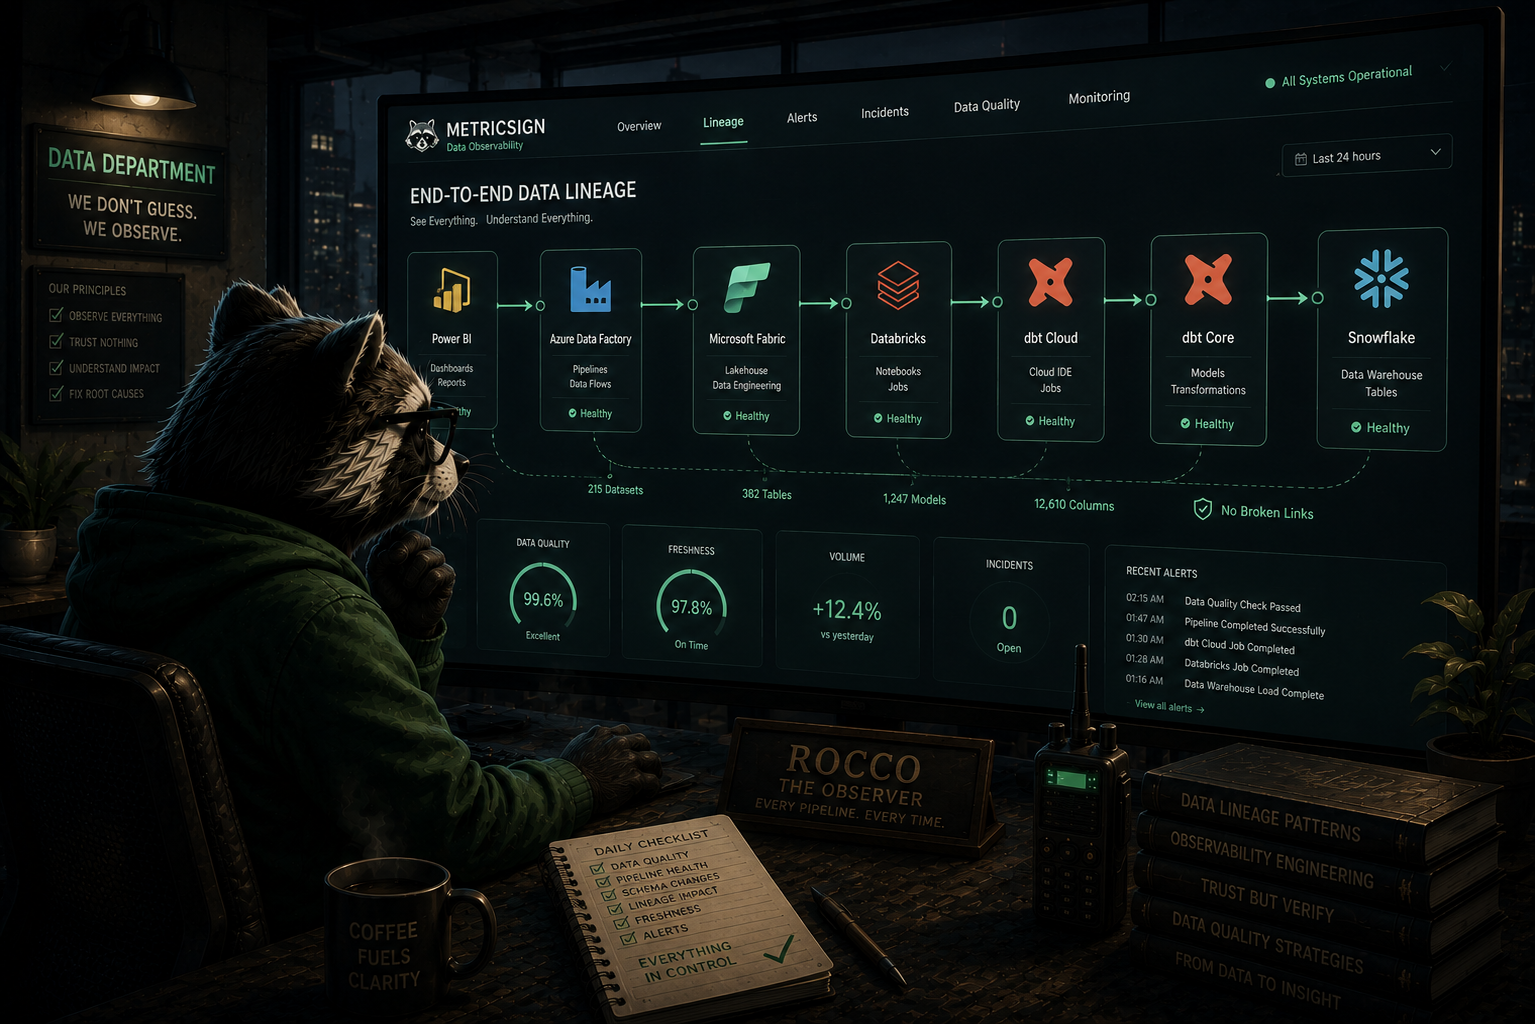
What a data observability platform does
A data observability platform monitors your data pipeline across every layer it passes through: ingestion, orchestration, transformation, storage, and BI consumption. It detects failures and anomalies in each tool, connects them via lineage, and tells you what broke, where it broke, and which downstream reports are affected.
The alternative is tool-native monitoring: each system sends its own alerts, your team watches multiple inboxes, and cross-tool incidents get discovered by users rather than by monitoring. For small, single-tool environments this is manageable. For modern data stacks that span ADF, Databricks, dbt, and Power BI, it breaks down.
The cross-stack problem no single tool solves
Data doesn't stay inside one tool. It moves: an ADF pipeline extracts from a source system and writes to a Fabric lakehouse. A Databricks job transforms it and writes to a Delta table. A dbt model reads that table and builds a mart. Power BI refreshes a dataset from the mart and serves it to 40 users.
Each tool in that chain has its own monitoring. None of them knows about the others. When the ADF pipeline runs 30 minutes late because of a source system delay, the Databricks job waits. The dbt model runs on incomplete data. Power BI refreshes on schedule and loads stale numbers. Every system reported success or a localized delay. Nobody got an alert that explained the chain.
This is the gap that a cross-stack data observability platform fills. Not by replacing each tool's native monitoring, but by sitting above all of them and watching the connections between them.
What MetricSign monitors
MetricSign has native connectors for six layers of the modern data stack:
Power BI - Dataset refresh status, refresh duration trends, schema change detection, stale data detection, report-level impact when upstream jobs fail.
Azure Data Factory - Pipeline run status, activity-level failure detection, schedule delay alerts, cross-pipeline dependency tracking.
Microsoft Fabric - Dataflow and pipeline run monitoring, Lakehouse freshness tracking, Direct Lake dataset health.
Databricks - Job run status, run duration anomalies, job failure incidents, link to downstream dbt models and Power BI datasets.
dbt Cloud and dbt Core - Model run status, run step error detail with specific model and error type, manifest-based lineage from source to mart.
Snowflake - Query run health, connection status, upstream freshness impact on downstream pipelines.
All six connectors feed into a single lineage graph. An incident in any layer shows its downstream impact immediately.
Comparison: MetricSign vs alternatives
| Dimension | MetricSign | Monte Carlo | SummitView |
|---|---|---|---|
| Power BI native monitoring | Yes | Partial | No |
| Azure Data Factory | Yes | No | No |
| Microsoft Fabric | Yes | No | No |
| Databricks | Yes | Yes | No |
| dbt Cloud | Yes | Yes | No |
| Snowflake | Yes | Yes | No |
| Cross-stack lineage | Yes (full) | Warehouse-layer | No |
| Microsoft-stack focus | Yes | No | No |
| Agent installation required | No | No | No |
| Setup time | Under 15 min | Days to weeks | N/A |
| Self-serve pricing | Yes | No (sales call) | N/A |
Monte Carlo is a strong option for warehouse-centric stacks, particularly Snowflake and Databricks SQL. MetricSign is the better fit when Power BI is the consumption layer and the pipeline includes ADF or Fabric.
For a full platform comparison including Bigeye and Acceldata, see the best data observability platforms comparison post.
How to get started
MetricSign connects to your existing tools via native APIs. No agent installation, no pipeline changes, no custom tagging required. You point it at your Power BI tenant, your ADF workspace, your Databricks workspace, and it starts reading run history, activity logs, and metadata.
Most teams have their first connector live and their first alert configured in under 15 minutes. The free tier covers one workspace with no time limit.